Image Quality Metrics
Fundamental Image Metrics
Noise (Quantum Mottle)
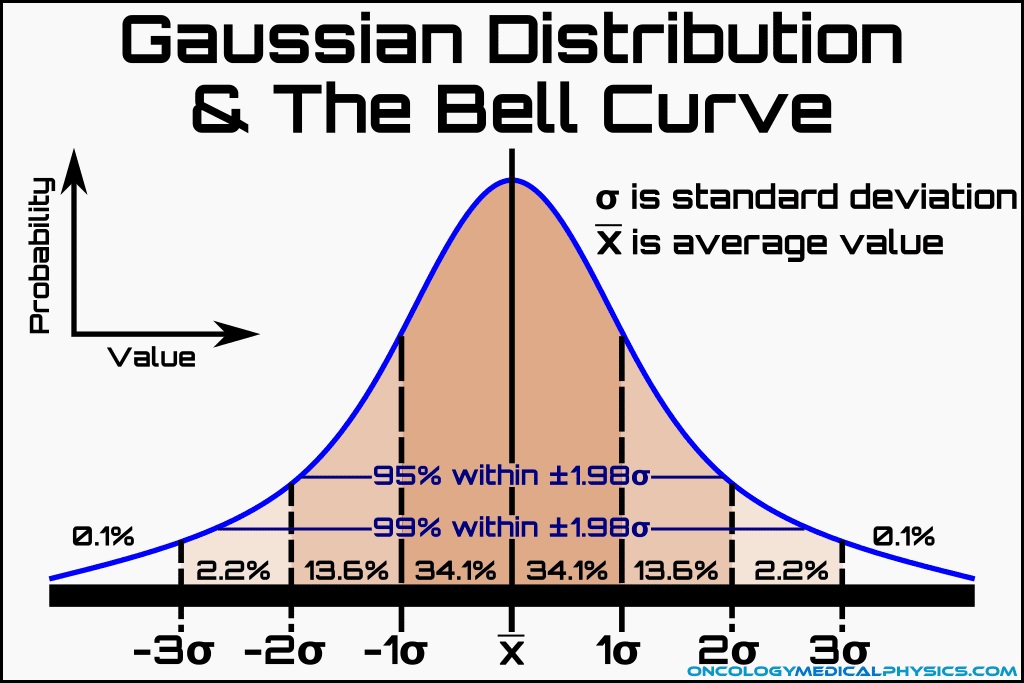
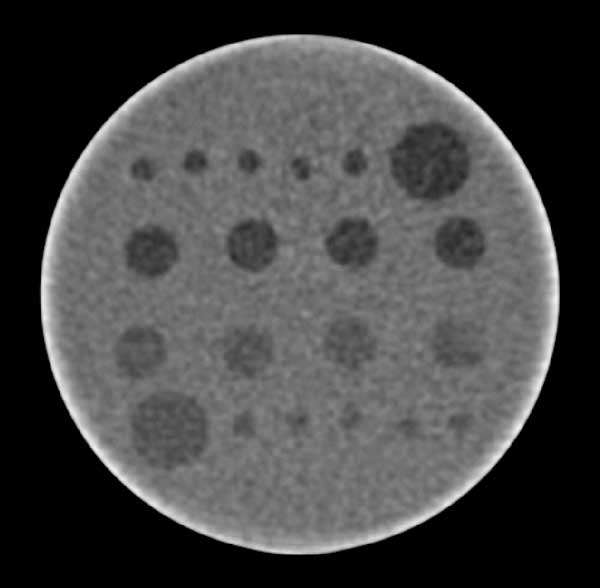
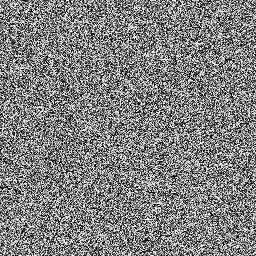
Image noise is the fluctuation in pixel intensity due to statistical uncertainty. Noise is typically measured as the standard deviation (σ) of pixel intensity over a uniform area. Reducing image noise is important as noise limits the ability to distinguish low contrast objects within an image. Image noise can arrive from the random fluctuations in photon distribution (photon statistics), digitization and electron noise sources such as dark currents.
![]()
-
- σ is the standard deviation
- xi is an event
- x̅ is the average number of events
- N is the number of measurements
Statistics of Image Noise
Image noise may be statistically modeled as a Gaussian Distribution which, for the large number of information carriers collected, may be approximated as a Poisson Distribution. The probability of observing x events over a given interval for a Poisson distribution may be computed using the below equation where m is the average number of events collected:
![]()
Standard deviation of a Poisson distribution may be simplified as:
![]()
This allows simple computation of signal-to-noise ratio (SNR) for Poisson distributions as:
![]()
Rose Criteria
The Rose Criteria states that a signal-to-noise ratio (SNR) of 5 or greater is required for reliable detection of an object within an image.
Contrast
Contrast is the difference in intensity, I, between two objects in an image. Contrast allows differentiation between objects:
![]()
Factors influencing contrast
- Inherent contrast between subject and background
- Display contrast
- Window
- Level
- Physical perturbations
- Fogging
- Scatter
- Non-uniform detector efficiency
Spatial Resolution
Spatial resolution (R) is the minimum separation between two high contrast objects such that they appear as two separate objects, often measured in line-pairs per millimeter (lp/mm).
Factors influencing spatial resolution
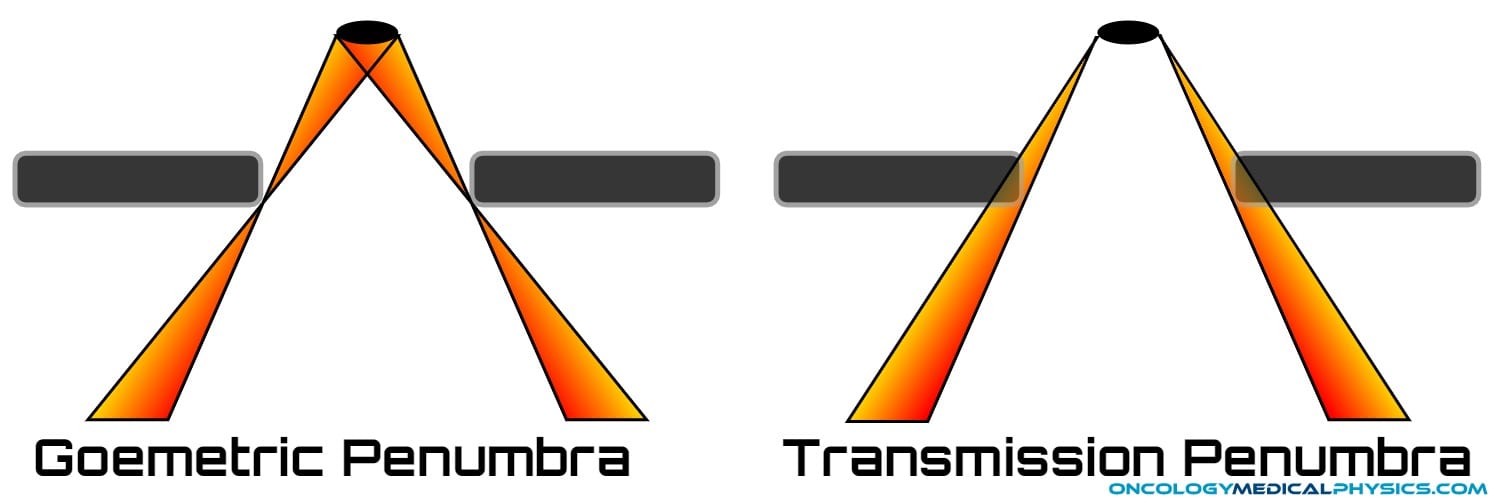
- Geometric penumbra
- Unsharpness originating from finite source size in radiographic systems.
- Subject unsharpness
- Rather than a sharp differentiation between subject and background the edges may blur together.
- Detector unsharpness
- Unsharpness arising from scatter or diffusion in the detector
- Motion (subject or detector)
| Modality | Spatial Resolution (mm) |
|---|---|
| Screen Film Radiography | 0.08 |
| Digital Radiography | 0.2 |
| Fluoroscopy | 0.125 |
| Screen Film Mammography | 0.03 |
| Digital Mammography | 0.05-0.1 |
| CT | 0.3 |
| SPECT | 7 |
| PET | 5 |
| MRI | 1 |
| Ultrasound (5MHz) | 0.3 |
Nyquist Frequency (FN)
The Nyquist Frequency is the minimum sampling frequency required for an object to be distinguished. The concept of the Nyquist frequency is taken from waveform analysis. For a waveform, the Nyquist frequency is twice the frequency of the waveform.
When applied to image analysis, the Nyquist frequency is half the size of the object.

Aliasing
When an object is sampled at a lower frequency than its Nyquist Frequency, its appearance will be inaccurate even in a system with zero noise and high contrast. This inaccuracy, resulting from insufficient sampling, is known as aliasing.
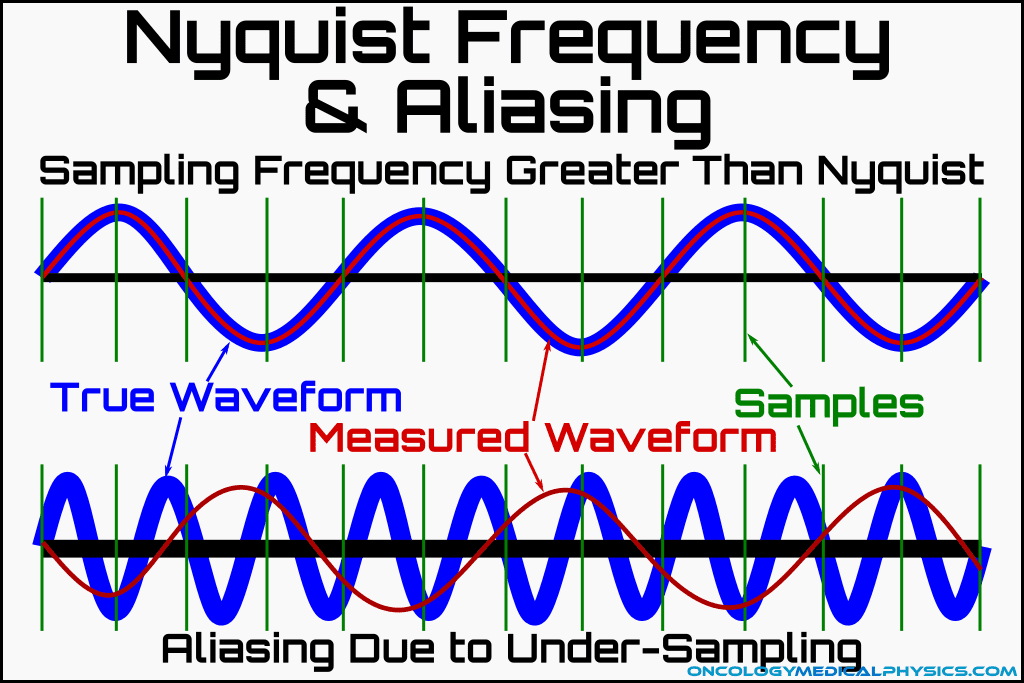
Key Point: Smaller objects have a higher frequency in the frequency domain. This is a result of the Fourier transform.
Quantitative Image Analysis
Contrast-to-Noise Ratio (CNR)
Contrast-to-noise ratio (CNR) is a metric that relates how easily low contrast objects may be distinguished from their surroundings. Higher CNR indicates a more readily distinguishable object.
![]()
Noise Power Spectrum (NPS)
Noise power spectrum (NPS) is used to describe how the magnitude of image noise varies with spatial frequency.
There are two types of NPS noise:
-
- Uncorrelated (white) noise: Noise which does not vary as a function of spatial frequency
- Correlated noise: Noise which changes as a function of spatial frequency
Modular Transfer Function (MTF)
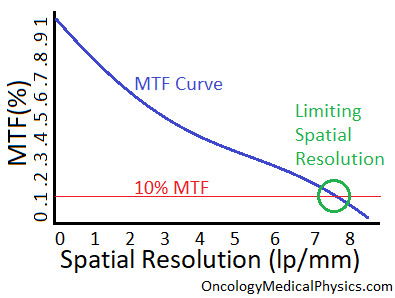
Modular Transfer Function (MTF) is a measure of a detector system’s ability to render contrast as a function of spatial resolution. MTF = 0.1 is generally taken to be the limit of detectability for humans.
![]()
Detective Quantum Efficiency (DQE)
Detector Quantum Efficiency (DQE) is a measure of the imaging system’s efficiency in converting data carriers into an image. DQE is influenced by every component of the imaging system and is a good metric of overall dose efficiency for an imaging system.
![]()
Quantum Detection Efficiency (QDE)
Quantum Detection Efficiency (QDE) is a measure of how efficient the detection system is at collecting information carriers. DQE is impacted by a number of factors including detector construction and geometry.
![]()
Knowledge Test
This is the sample version of the full quiz. Log in or register to gain access to the full quiz.
Navigation
Not a Member?
Sign up today to get access to hundreds of ABR style practice questions.

