
CT Theory of Operation
Basic Imaging Process
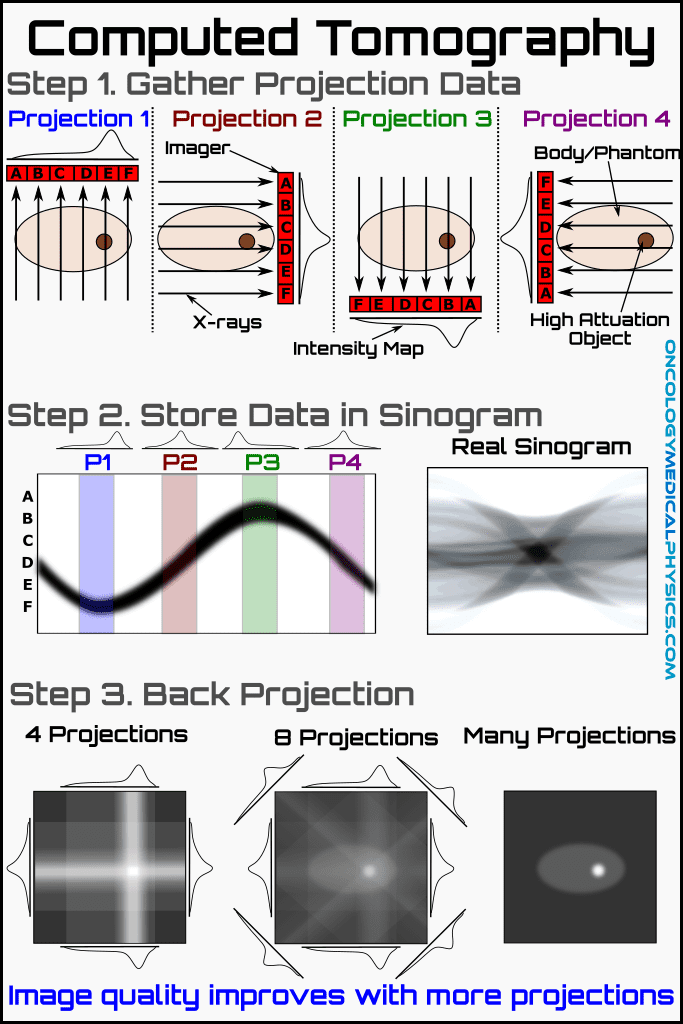
- The X-ray tube emits an X-ray beam at a given gantry angle.
- The beam passes through the patient and is intercepted by an imaging detector element.
- The detector element emits a scintillation photon which is detected by a photon detector and converted into an electronic signal.
- The electronic signal of each element at each gantry position is assembled in a computer and a sinogram is generated.
- The sinogram is converted into a CT image using either filtered back projection or iterative reconstruction.
Important Terms
Ray: A single transmission measurement made by a detector element at a given gantry position.
Projection: The sum of all rays at a given gantry angle is referred to as a projection.
Sinogram: A sinogram is a map of projections as a function of gantry orientation.
What CT Scans Measure
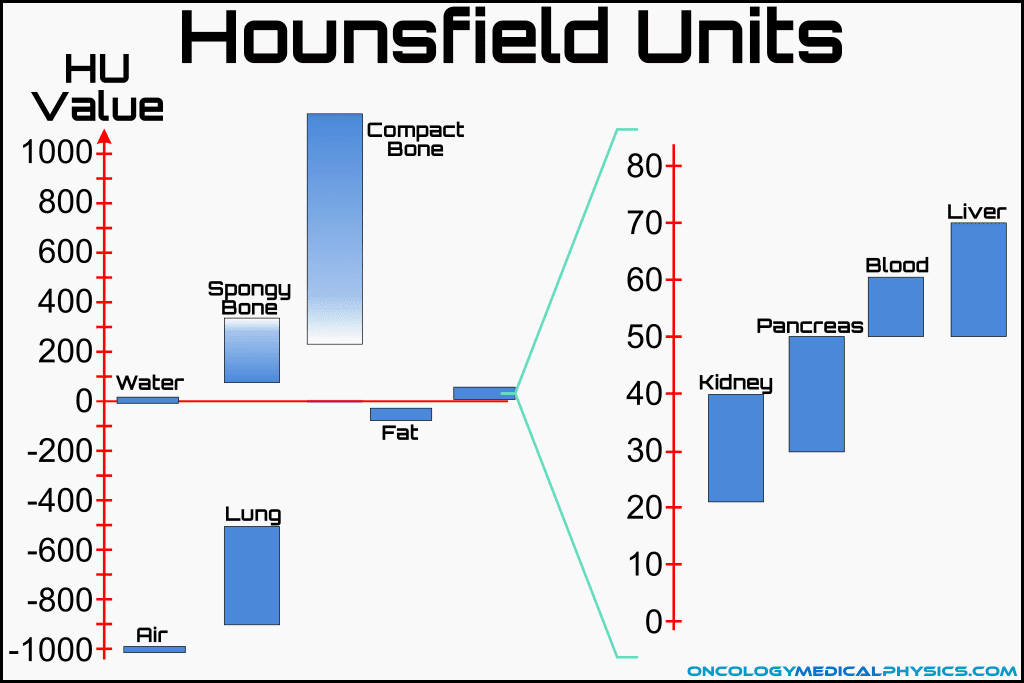
Hounsfield Units
CT images are essentially maps of the linear attenuation coefficient (μ) of each voxel. The linear attenuation coefficient is measured in units of Hounsfield Units sometimes also called CT numbers:
![]()
Linear Attenuation Coefficient
Linear attenuation coefficient, μ, is the percentage of a beam attenuated per unit path length. For kilovoltage energy beams passing through tissue, linear attenuation coefficient is dominated by the Compton interaction:
![]()
- I0 is the initial intensity of the beam
- Ix is the intensity of the beam after passing through x distance of material
- x is the length of material traversed
Since the Compton interaction is proportional to Z/A, linear attenuation coefficient is approximately proportional to physical density for human body tissues. This is because the Z/A for most elements common to organic materials is 0.5. Hydrogen is an exception to this with a Z/A of 1.
Scanner Hardware
External Components
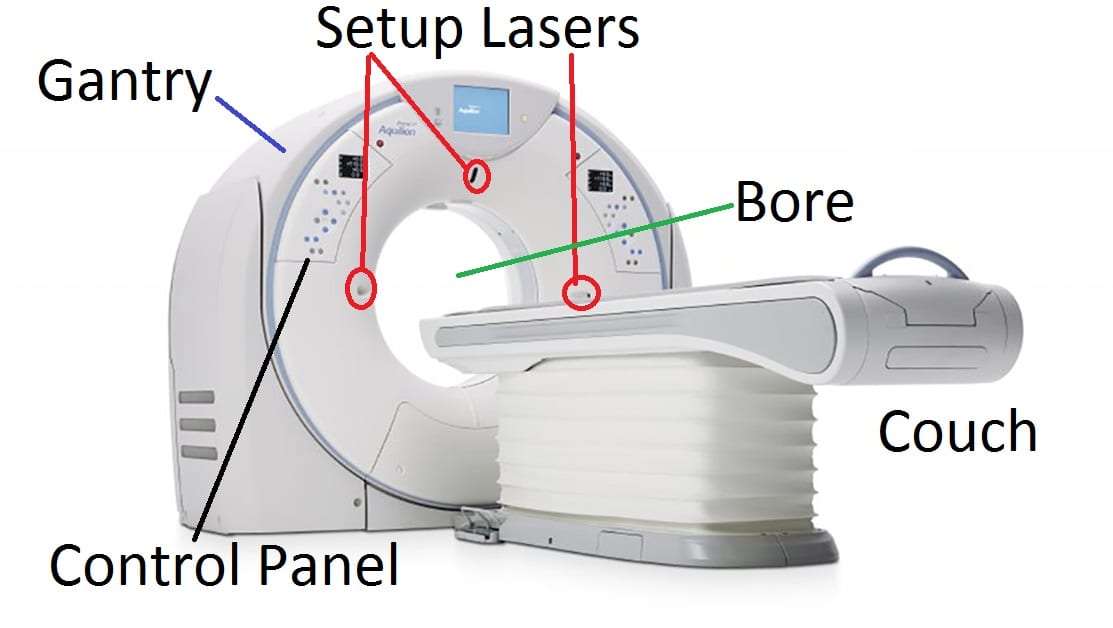
Gantry
The gantry is the main structure of the scanner.
Bore
The patient transits through the bore during a scan. Typical bore sizes are between 70cm and 85cm in diameter.
Setup Lasers
Setup lasers projected from the bore are used to center the patient in the bore prior to a scan.
Couch
The patient rests on the couch or table which is able to raise or lower and travel into and out of the bore during a scan.
Control Panel
The control panel is used to position the couch, activate the lasers and perform other necessary tasks prior to a scan.
Internal components
X-ray Source
The X-ray source consists of a heated filament electron gun which accelerates electrons toward a positively charged anode. The anode, also known as the target, generates kilovoltage (kV) photons via the Bremsstrahlung interaction.
Typical source features
- Tungsten alloy target
- Oil circulated to improve heat dissipation
- Focal spot size: 0.6-1.2mm
- Smaller means less penumbra (sharper images) but also greater local head buildup.
- Operating voltage: 80 - 140kVp
- Beam filtration: 5-10 mmAl
Detector Array
Detector arrays consist of multiple rows of scintillation type detectors. Scintillation signal is read out by photodiodes and converted to a digital signal for processing.
The array rotates opposite of the X-ray source on the gantry and collects data along multiple channels simultaneously.
Typical detector array features
- Scintillation type Gd2O2S detectors
- Modern scanners can collect at least 64 slices simultaneously
- Some scanners collect up to 320 or more slices per rotation!

Bow Tie (Beam Shaping) Filter
The Bow Tie filter attenuates the lateral portions of the beam which would pass through less tissue during imaging. This reduces patient dose while yielding more uniform fluence pattern at the detector.


Image Acquisition Parameters
Energy and Current
Peak Potential (kVp)
Beam energy is typically referred to as peak potential or kVp (kilovoltage peak). Higher kVp increases the beam's ability to penetrate tissue resulting in a lower dose for the same exposure but at the expense of soft tissue contrast.
Typical values: 80kVp (adolescents) to 140kVp (large adults)
Effects of increasing kVp
- Decreased patient dose
- Decreased soft tissue contrast
Beam Current (mA)
Photon fluence is directly proportional to beam current. Increasing mA will not impact CT number or contrast but will increase patient dose and signal.
Typical values: 100-600mA
Effects of increasing mA
- Increased patient dose
- No impact on contrast
- Reduced image noise
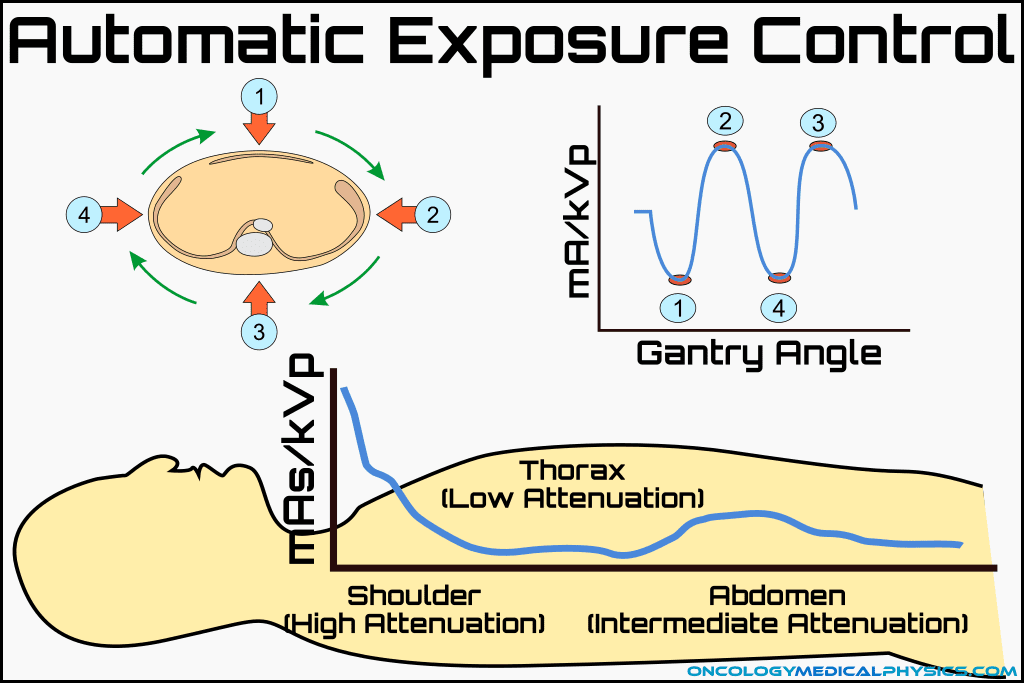
Automatic Exposure Control (AEC)
Automatic exposure controls modulate either kVp or mA in an attempt to normalize the detector fluence. This yields a roughly uniform signal-to-noise ratio in the image while minimizing patient dose.
mA Modulation
mA modulation changes the X-ray tube current as the tube rotates to account for variable thickness of the body. That is, it may reduce mA in the head and neck but increase the current at the level of the clavicle. mA modulation typically requires a scout image to assess the appropriate beam current at each position.
kVp Modulation
kVp modulation is not regularly used in radiation therapy because the non-uniform changes to CT number make attenuation corrections in treatment planning difficult.
Spatial Resolution
Image Grid
Image grids refer to the number of voxels in each slice. Typical modern scanners produce 512 by 512 voxels per slice although older 256 by 256 scanners may still be encountered. Increased image grid size increases spatial resolution.
Field-of-View (FOV)
Since image grid doesn't change, changing the FOV impacts the amount of tissue encompassed in a single voxel. The typical nominal FOV is 50cm in diameter meaning that, for a 512 by 512 image grid, each voxel encompasses approximately 1mm2 of tissue. If the field of view is reduced to 25cm, each voxel would contain approximately 0.5mm x 0.5mm = 0.25mm2 of tissue.
Slice Thickness
Slice thickness is the axial width of each image. Reducing slice thickness improves axial spatial resolution and reduces volume averaging. Typical values range from 0.6-5mm per slice.
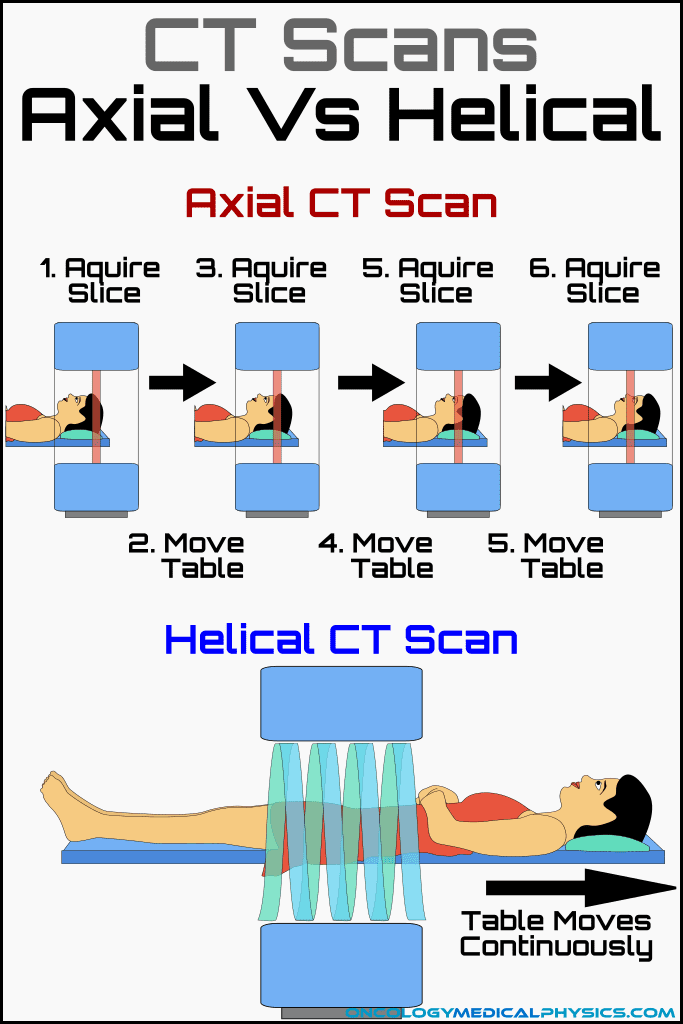
Acquisition Mode: Axial vs. Helical Scans
Axial Scan
The gantry rotates and collects imaging data while the patient is stationary. This is an image > step forward > image type acquisition.
Helical Scan
The couch moves continuously forward during imaging. This approach, not in use until generation six scanners, improved the speed of image acquisition.
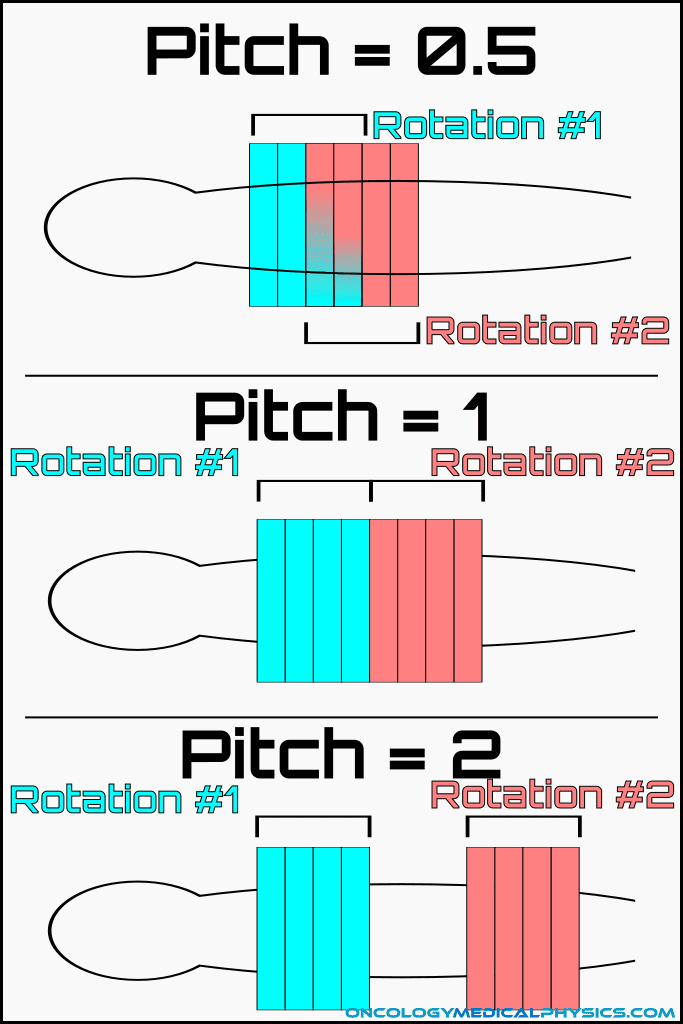
Pitch
Pitch is the ratio of table motion per revolution to beam width. Pitches greater than 1 indicate a gap in the helix of the scan but do not cause missed slices. Typical pitch values range from 0.5 to about 1.5.
![]()
Effects of increasing pitch
- Decreased scan time
- Decreased patient dose
- Decreased image resolution
- Increased image noise
Factors Impacting Image Noise
Noise in CT images (σ) is inversely proportional to the square root of the number of photons reaching the imager.
Noise may be approximated by the expression:
![]()
- Patient attenuation (B)
- Voxel size (V)
- mAs settings (mAs)
Key Point: To reduce image noise by 50%, the number of photons recorded per voxel must by quadrupled!
Contrast Agents
Most CT contrast agents take advantage of a k-edge to increase photon attenuation. The k-edge is the binding energy of the inner (k-shell) electron orbital of an atom. There is a sudden increase in the attenuation coefficient for photons of energies just above the k-edge of an atom. This increase in attenuation may be thought of as a resonance phenomenon and occurs because of the photoelectric interaction.
Iodine
Iodine is the most commonly used CT contrast agent for vascular studies. Iodine contrast is administered intravenously. The k-edge of iodine is 33.2keV.
Barium
Barium is a common CT contrast agent used in gastrointestinal studies. The k-edge of barium is 37.4keV.


Reconstruction Algorithms
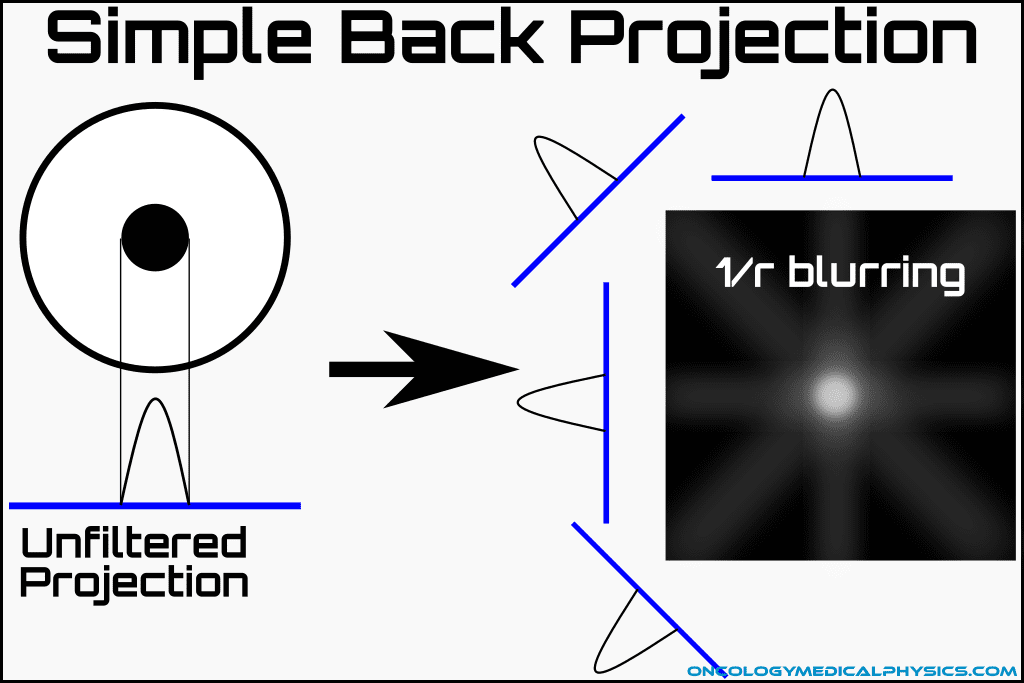
Back Projection
Back projection takes the data gathered at a given gantry angle (a projection) and projects it backward across the slice. All projections of a given slice are back-projected together resulting in a crude reconstruction of the original image. Back projection alone results in significant blurring, referred to as 1/r blurring, which degrade image quality.
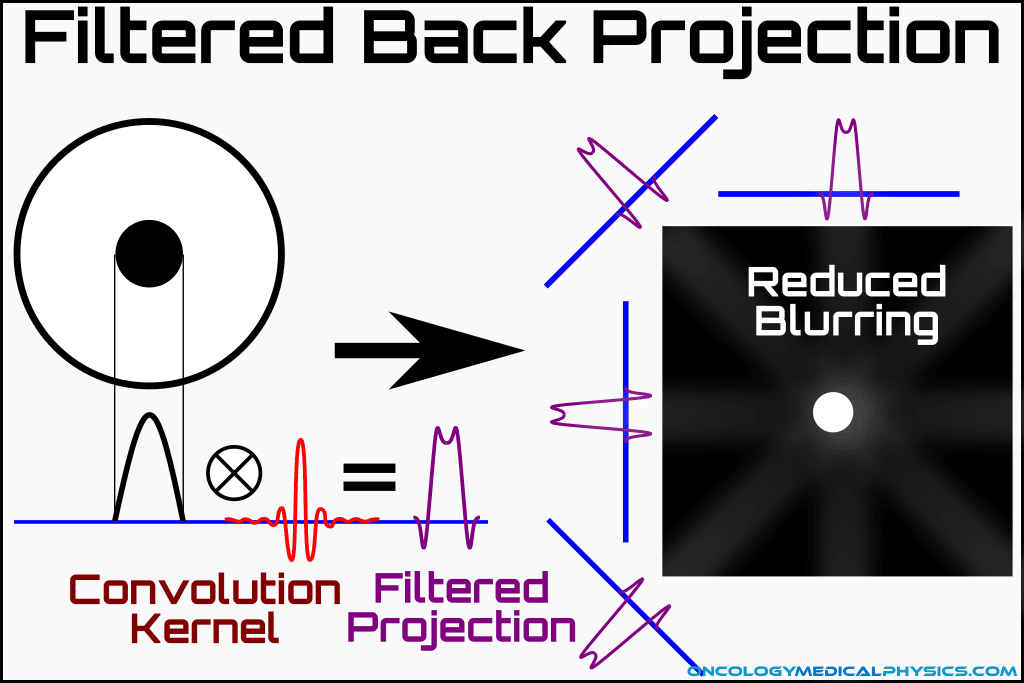
Filters and Kernels
The characteristic 1/r blurring of a back projected image can be overcome by applying a filter or kernel using a mathematical operation known as Convolution. Convolution allows the combination of a projection image with a filter/kernel resulting in an image free of characteristic blurring.
Many different kernels are available for purposes such as improving soft tissue contrast, increasing the sharpness of images, and artifact reduction.

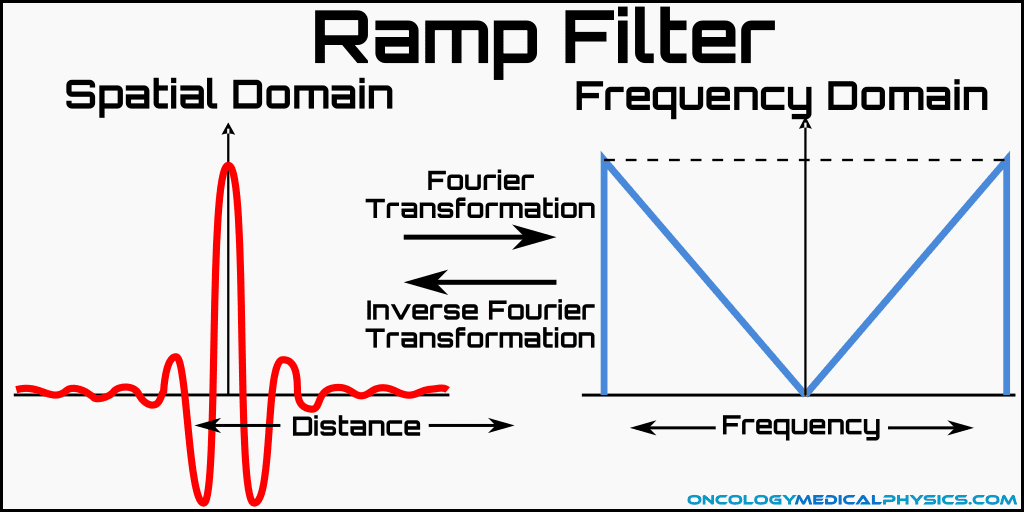
Ramp Filter
The ramp filter is commonly employed to eliminate 1/r blurring. Ramp filters are applied to k-space (frequency domain) data and act by suppressing low spatial frequencies. This filter also has the negative effect of increasing image noise which is largely contained in the unsuppressed high frequency portion of k-space.
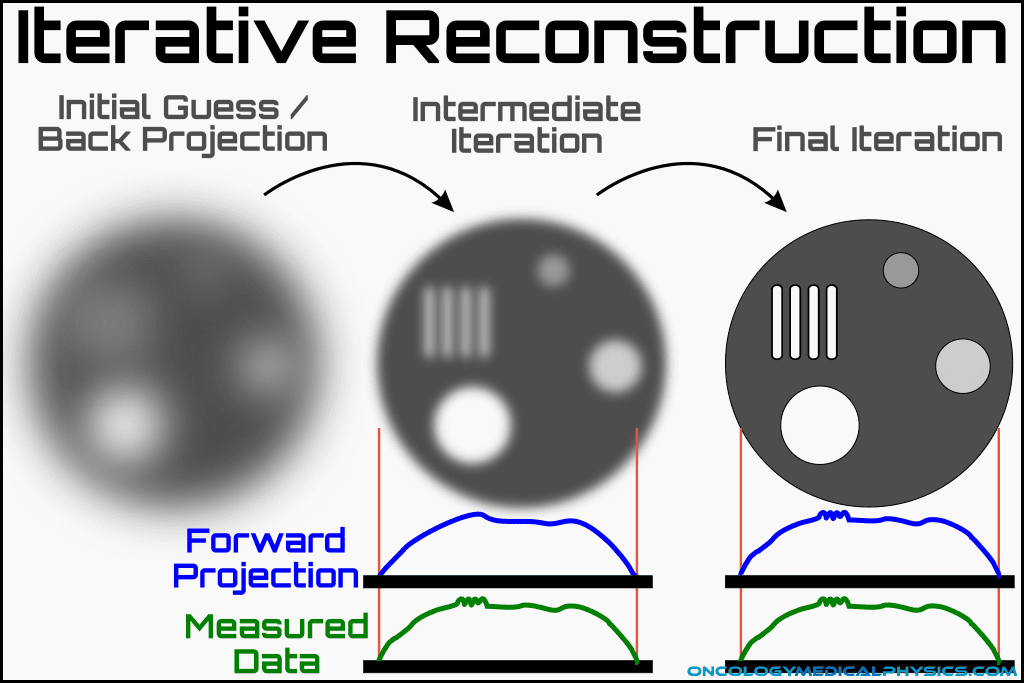
Iterative Reconstruction
Iterative reconstruction begins with a seed image, which is either model based (e.g. a general brain image) or based on a filtered back projection. The computer then determines what projections would have been measured is the seed image was the true image. Based on the differences between the calculated projections and the measured projections, the computer generates a new seed image. This process is repeated until arriving at a final image.
Iterative Reconstruction Process
- Initial seed image is generated
- Initial seed may be a stock image, a random guess or a filtered back projection image.
- Computer determines what projections would have been measured if the seed image was the true image.
- The difference between the calculated projections and the measured projections is computed and used to determine a new seed image.
- This process is repeated until the difference between calculated and measured projections is below a given threshold.
Advantage and Disadvantages
Advantages
- Higher signal-to-noise ratio than back projection with the same patient dose.
- Very high-quality reconstructions can be generated.
Disadvantages
- Seed image may bias final image.
- I.e. Local minima of projection agreement metric may be sub-optimal.
- Possible false details consistent with seed image but smaller than the scanner can truly resolve.
Navigation
Not a Member?
Sign up today to get access to hundreds of ABR style practice questions.