
Diagnostic Probabilities
Receiver Operating Characteristics & Bayesian Statistics
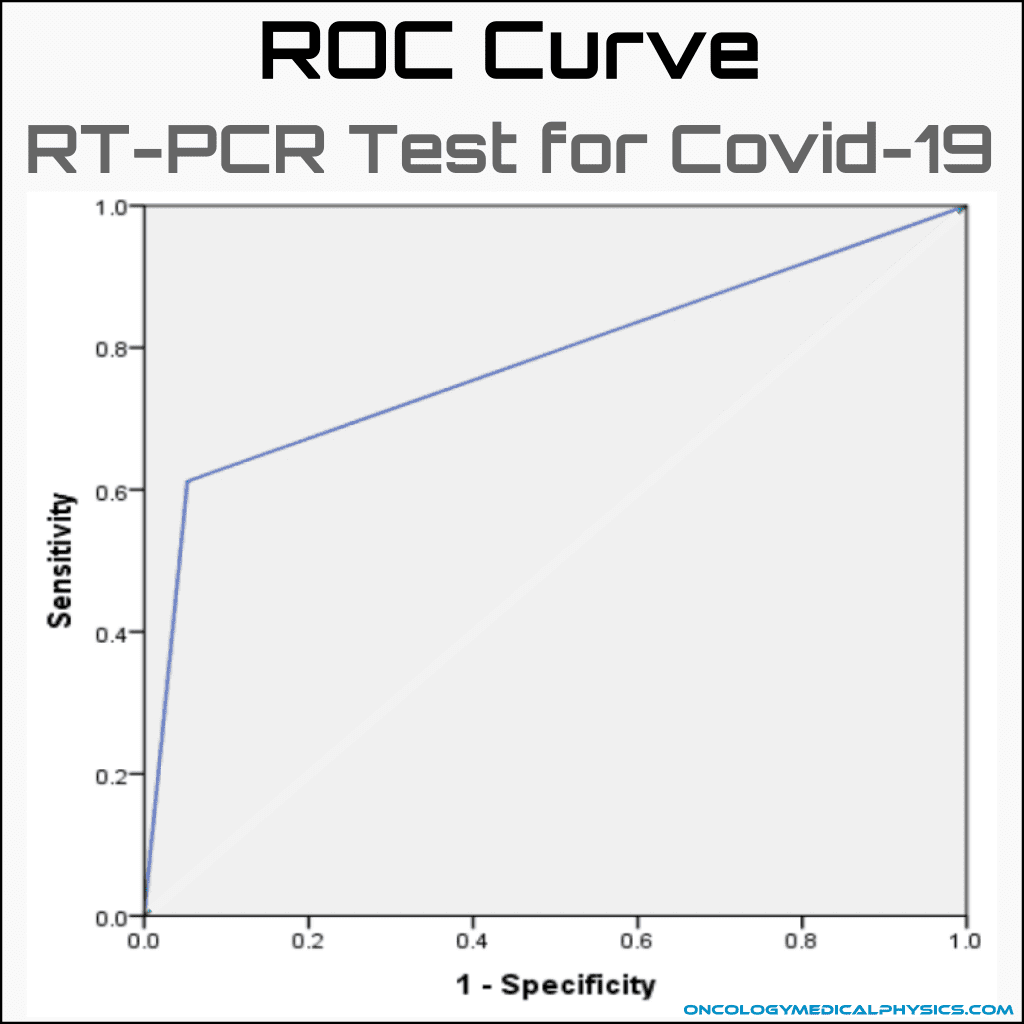
Receiver Operating Characteristic (ROC) Curves
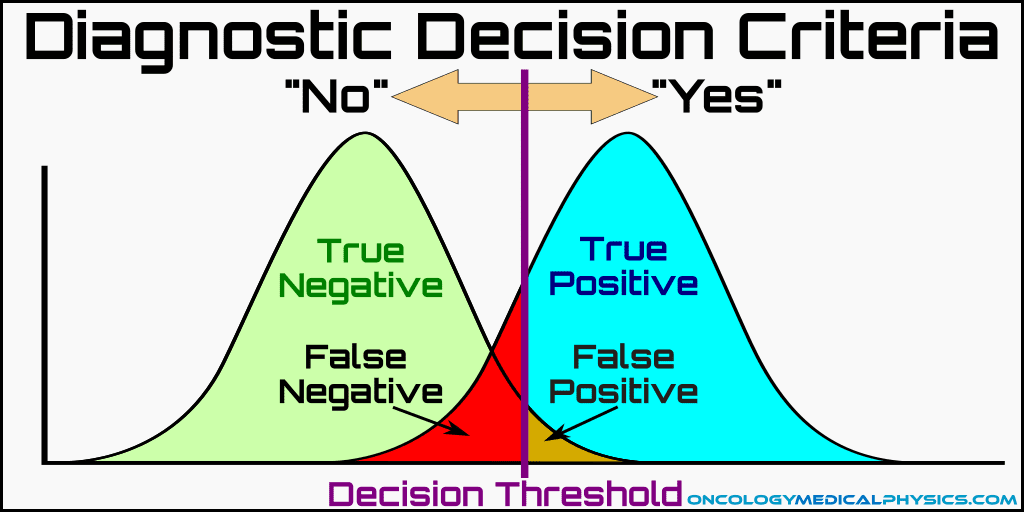
ROC curves plot the probability of correct detection (true positive) as a function of the probability of false detection (false positive). ROC curves are used to determine a detection method’s usefulness.
| Actually Abnormal | Actually Normal | |
|---|---|---|
| Diagnosed as Abnormal | True Positive (TP) | False Positive (FP) |
| Diagnosed as Normal | False Negative (FN) | True Negative (TN) |
Test Quality Metrics
Area under the curve (AUC): Higher is better; ideal is 1
Sensitivity: True Positive Fraction (TPF)
![]()
Specificity: Fraction of normal cases diagnosed correctly
![]()
False Positive Fraction (FPF)
![]()
Accuracy: Percent of cases correctly diagnosed
![]()
Positive Predictive Value (PPV): fraction of positive predictions which are accurate
![]()
Negative Predictive Value (NPV): Fraction of negative predictions which are accurate
![]()

Bayesian Statistics
Bayes’ theorem: Given the related events A and B, the probability of A given that B is true is equal to the probability of B given that A is true times the probability that A is true divided by the probability that B is true.
![]()
Bayes’ theorem, the basis of Bayesian statistics, is finds a variety of uses ranging from assessing the probability that a test subject has a medical condition to spam filtering (external link). In medicine we are most often interested in answering the question “What is the probability that a patient has a disease given that a test yields a positive result.” Understanding Bayesian statistics is especially important for the case of rare diseases as the results can be counter-intuitive.
For example, say that a diagnostic test is known to correctly identify the 99% of all subjects with a given disease and that only 0.1% of the population has that disease. The test in this example also incorrectly yields a positive result for 2% of healthy subjects. What is the probability that a patient who has a positive test result actually has the disease? (Hint: It’s not 99%!)
Bayes’ theorem says that the probability of a subject with a positive test has the disease, P(A|B), is dependent not only on the probability that a diseased subject will be correctly identified, P(B|A), but also on the probability that the subject has the disease in absence of the test, P(A), and the total probability of a positive test, P(B).
Using the notation of an ROC diagram, Bayes’ theorem can then be rewritten as:
![]()
If no prior tests have been performed, the probability that the subject has the disease in absence of the test [P(A)] is taken as the incidence rate of the disease in the population of interest. In the above example this would yield a probability that the patient actually has the disease as only 4.7%!
![]()
If the same test is run again on the same subject and another positive result is found, the prior probability, P(A), is now taken to be 4.7%. This yields a probability that the subject has the disease of 70.9%.
![]()
Only on the third sequential positive test to is the probability that the subject has such a rare disease finally reaches 99.2%!
Navigation
Not a Member?
Sign up today to get access to hundreds of ABR style practice questions.