
Identifying Radionuclides
Radionuclide Identification Process
Radionuclide identification is achieved by measuring the type, energy, and relative quantities of the products of radioactive decay such as photons (x-rays & gamma-rays), charged particles (electrons, protons, heavy particles), and neutrons. This information can be compared with reference or theoretical data on known radionuclide emissions to determine the type or types of radionuclide present and their relative abundance.
Identifying Decay Products
Determination of types of decay product that are present is a complicated process requiring multiple counting measurements. Below are some of the commonly used determination techniques:
Differential Attenuation
Differential attenuation relies of multiple measurements of a radiation source in which the decay products must travel through various materials to reach the detector. Comparing the signal from decay products passing through various attenuators provides information about both the type and energy range of the decay products. A simple experiment would be performed as follows:
- The emissions of a radioactive source are measured, and the resulting detector signal is recorded.
- A low attenuation attenuator, such as a piece of paper, is placed to separate the source and the detector. If the detector signal is much lower than the unattenuated signal, the radiation is likely to include non-ionizing photons, alpha particles, or other heavy charge particles. If the signal is not greatly changed, the source is unlikely to include these readily attenuated forms of radiation.
- A medium attenuation attenuator, such as 1-4mm of aluminum, is placed between the source and the detector. If the detector signal is much lower than the previous measurements, the source is likely to include kilovoltage x-ray photons and electrons.
- A high attenuation attenuator, such as 1-5mm of lead, is placed between the source and the detector. If the detector signal is much lower than the previous measurements, the source is likely to include megavoltage gamma-ray photons.

Magnetic Analysis
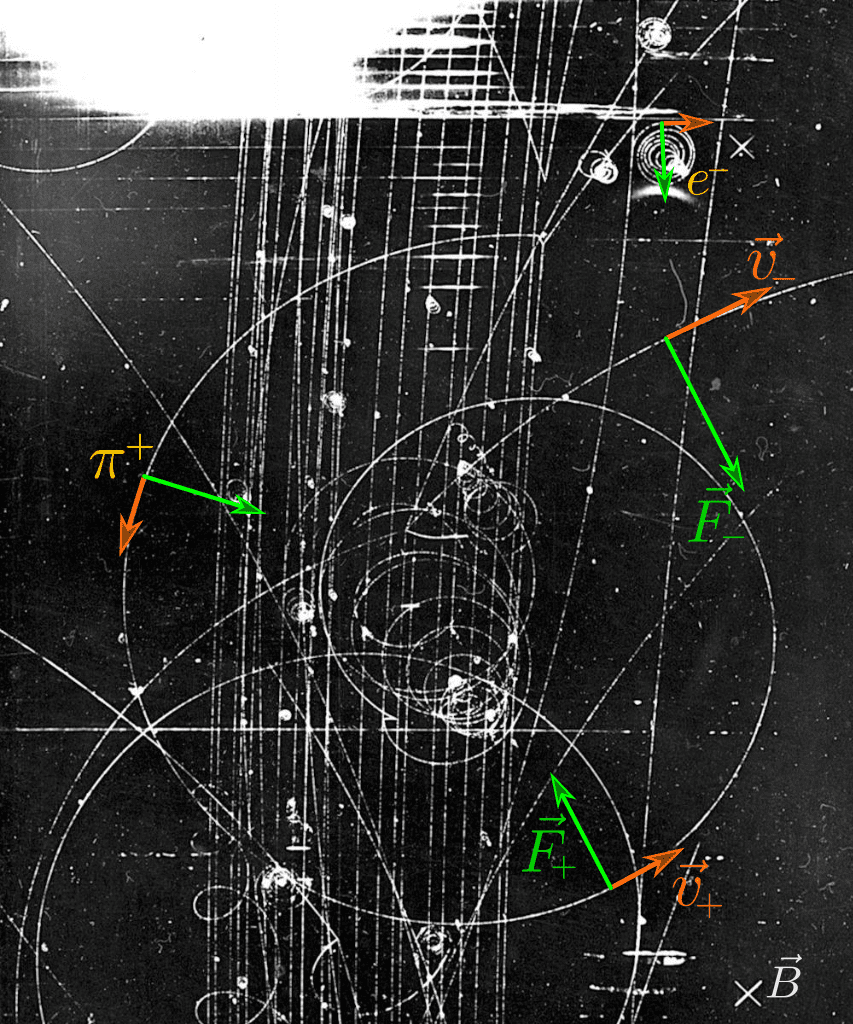
Moving charged particles (electrons, protons, alpha particles, etc) are deflected in a magnetic field by the Lorentz force. This effect can be used to determine if a particle is charged by forcing the radiation to pass through an aperture, then a magnetic field, and finally a second aperture prior to reaching the detector. If radiation is detected when measuring along a straight path, illustrated below, the radiation is known to be uncharged photons or neutrons. If the radiation is found to be comprised of charged particles, the angle of deflection along with the strength of the magnetic field can be used to determine the ratio of particle momentum, which is a function of mass and energy, to charge.
![]()
- F is Lorentz force
- q is the charge of the particle
- v is the particle velocity
- B is the strength of the magnetic field
![]()
- r is the radius of particle deflection
- m is the particle’s mass
- mv is the momentum of the particle
Determining Energy of Day Products
Pulse Height Spectrum Analysis
The response of several types of detectors is proportional to the energy of the incident radiation. The amplitude of each detection event may be used to determine the energy of the incident particle. Data recorded in this way is often used to produce a graph of the relative abundance of each energy detected. This type of graph is known as a pulse height spectrum diagram.
Detectors Used for Pulse Height Analysis
- Germanium detectors
- Highest energy resolution
- Scintillation detectors
- Gas filled proportional counters
Components of a Pulse Height Diagram
Full Energy Peak
The full energy represents counts where all of the energy of the decay product is fully captured.
X-ray Peak
When a photoelectric event occurs in the detector, the absorber atom may release a characteristic X-ray. This X-ray is often collected by the detector causing an X-ray peak. Most X-ray peaks occur at the K-shell binding energy of the absorber atom.
Backscatter Peak
Backscatter peaks are caused by backscattered photons after a Compton interaction with the detector.
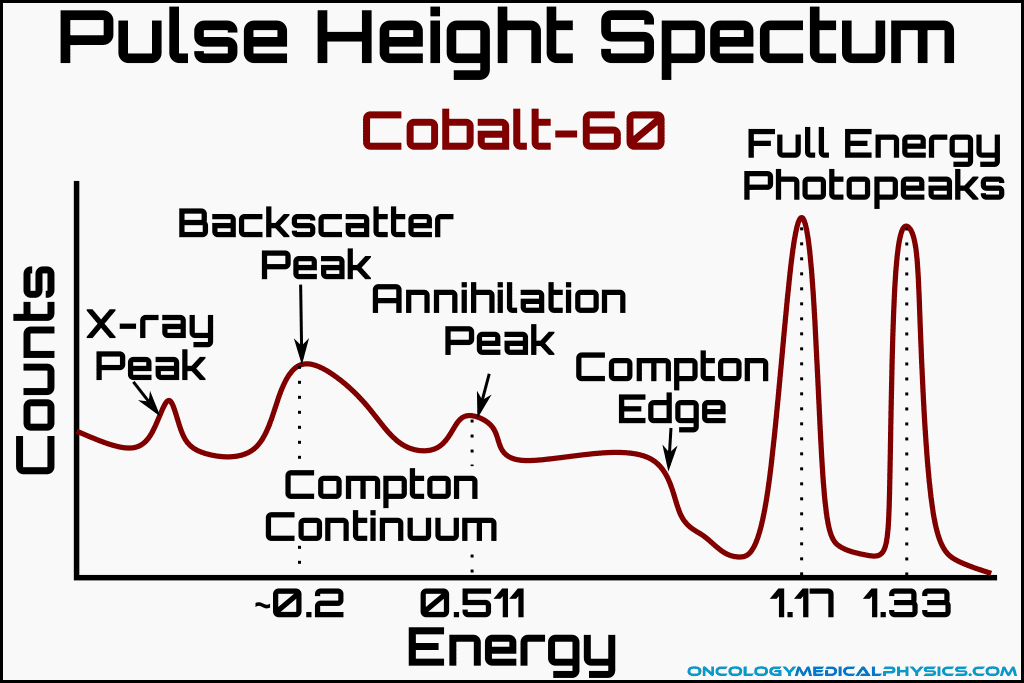
Annihilation Peak
Annihilation peaks are caused by annihilation of the positrons formed during pair and triplet production. Annihilation peaks have an energy of 0.511MeV (i.e. the rest mass energy of a positron).
Compton Continuum and Compton Edge
The Compton continuum is caused by the capture of electrons liberated via Compton interactions. The Compton edge represents the maximum energy transferrable to a Compton scattered electron by the incident photon.
Energy Resolution
Energy resolution is a measure of how precisely the measurement device is able to determine energy of a detection event. In pulse higher spectrum diagrams, energy resolution is assessed measuring the width of a peak at half of the maximum height of the peak. This measurement is known as Full Width at Half Maximum (FWHM). Smaller values of FWHM indicate a superior energy resolution.

Navigation

Not a Member?
Sign up today to get access to hundreds of ABR style practice questions.