
Counting Statistics
Characterizing Data
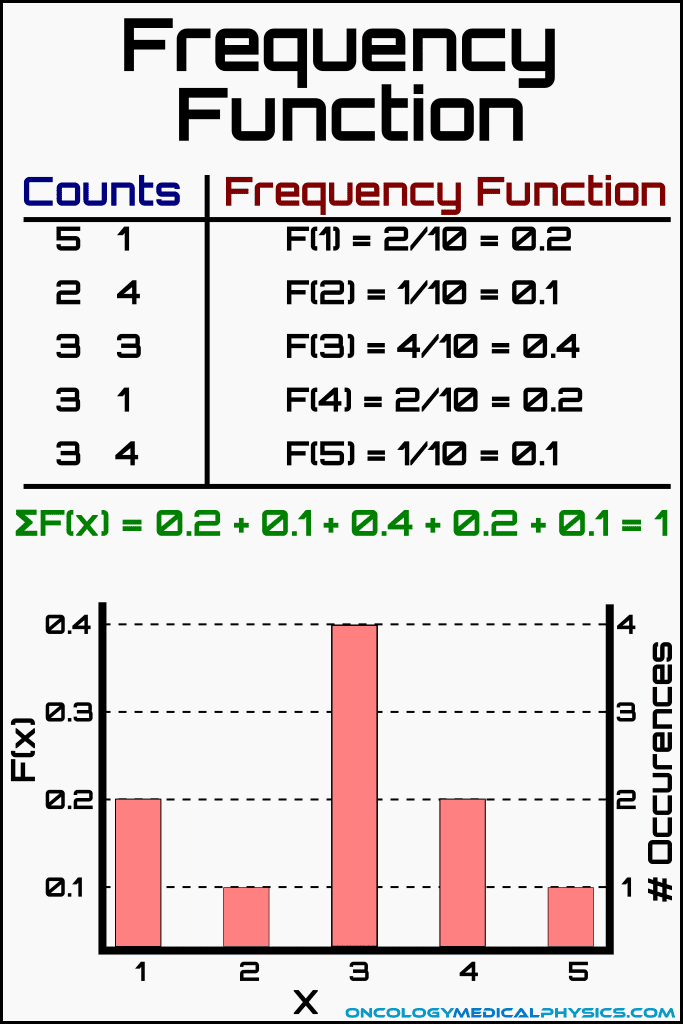
Frequency Function
The frequency function described the relative frequency of a given measured value within the set of measurements. For example: the frequency function describing the probability of getting heads would be described as the number of heads recorded divided by the number of coin flips. A more advance example of a frequency function would describe the probability of measuring a given number of radioactive decays (x) within a given number of measurement intervals (N). Note that N is the number of measurements taken for a given interval, not the length of the interval.
![]()
Importantly, the sum of all frequency functions is equal to 1 by definition.

Key Point: Any set of data can be completely described by its frequency distribution function, F(x). Radiation Detection and Measurement, G.F. Knoll, 4th edition.
Average Value (x̅)
The average, or mean, value of any frequency function can be calculated as:

Sample Variance (σ 2)
Sample variance is a metric which describes how different a typical measurement is from the other measurements. Variance is defined as average squared difference between measured values and the mean value of the distribution.
![]()
![]()
Key Point: Variance is less commonly reported than standard deviation because squaring causes variance to have different units than standard deviation.
Standard Deviation (σ)
Like variance, standard deviation is another metric of the spread of the distribution but, unlike variance, standard deviation has the same units as the mean value. Standard deviation is defined as the square root of the variance.
![]()
Sample Vs Population Data
Population: The entire set of subjects under investigation.
Sample: The subset of the population that data is directly collected from.
While measurement designed to determine statistics related to the population, measuring the entire population is often impossible or impractical. Instead, data collected in the sample is evaluated using one of the below statistical models in order to draw conclusions about the population.
Statistical Models
Binomial Distribution
The binomial distribution is the most universal model and is generally applicable to all distributions with constant probabilities. Despite this, the model is computationally more difficult than other models and is therefore not commonly applied to nuclear counting processes.
![]()
-
- n is the number of trials performed
- p is the probability of success for any given trial
- P(x) is the predicted probability of observing exactly x successes
Properties of a Binomial Distribution
Binomial experiments have 4 characteristics:
- It is considered as a set of discrete repeated trials
- The only possible outcomes are success or failure (it's binary)
- The probability of success is constant
- Each trial is independent of all other trials
Mean Value
![]()
Standard Deviation
![]()
Poisson Distribution
The Poisson distribution is a mathematical simplification of the binomial distribution model.
![]()
-
- P(x) is the predicted probability of observing exactly x successes
- x̄ is the average value of x
Assumptions of a Poisson Distribution
The simplification relies on the following assumptions:
- Probability of success, p, is small
- Probability of success, p, is constant
Critically, these assumptions are valid for radioactive decay counting experiments provided that the following are true:
- The number of radioactive nuclei remains near constant during the observation.
- The probability of recording a count from a given nucleus is small.
Properties of a Poisson Distribution
Mean Value![]()
Standard Deviation
![]()
Gaussian (Normal) Distribution
The Gaussian distribution is a further simplification of the Binomial distribution which removed the need to take the factorial of x in the denominator of the Poisson distribution equation. Gaussian distributions are commonly used in counting problems which have a large average number of successes (I.e. a mean value greater than about 25).

-
- P(x) is the predicted probability of observing exactly x successes
- x̄ is the average value of x
Assumptions of a Gaussian (Normal) Distribution
The simplification relies on the following assumptions:
- Probability of success, p, is small
- Probability of success, p, is constant
- The average number of successes is relatively large (I.e. greater than approximately 25 or 30)
Properties of a Gaussian (Normal) Distribution
Mean Value![]()
Standard Deviation
![]()
Properties unique to Gaussian distributions
- Gaussian distributions are symmetrical about the mean value.
- This is why Gaussian distributions are poor approximations of Poisson and Binomial distribution for distributions with a small mean number of successes as those distributions tend to be skewed for low means.
- Since the average value is large, the values of P(x) for adjacent values of x are similar.
- This allows for a further simplification by treating the discrete bins of a Gaussian distribution as a continuous integrable function.
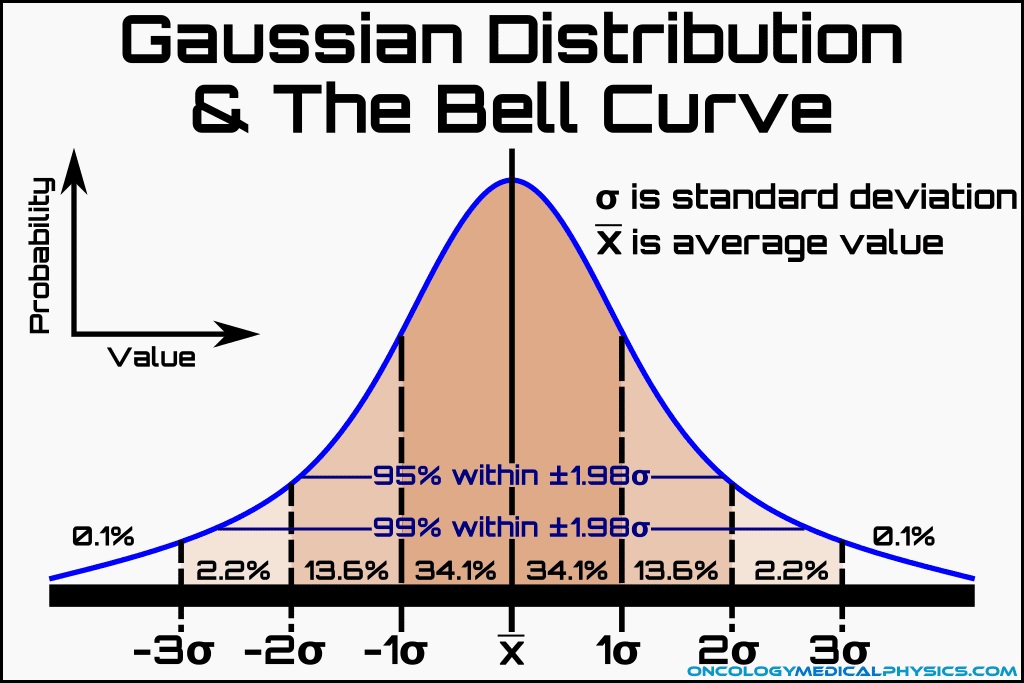
Bell Curve and the Gaussian Distribution
As noted above, the Gaussian distribution is symmetric about the mean value and can be approximated as a continuous integrable function. These properties allow assessment of the probability of observing a given deviation from the mean (ε) using the following:

Where deviation (ε) is defined as:
![]()
Because G(ε) is found to be highly influenced by standard deviation, it is useful to define a new term, t, as the ratio of the deviation to the standard deviation. That is, t is defined as the deviation normalized to the standard deviation about the mean. This gives rise to the most familiar form of the Gaussian bell curve in which probability of a measurement occurring within a given range is determined by the range of standard deviations from the mean into which those measurements fall.

Where
![]()
Probability of a value falling between 0 and t can be found by solving:

Where f(t) is the probability that a random sample from a Gaussian distribution will yield a value of t that is less than the observed value.
Navigation
Not a Member?
Sign up today to get access to hundreds of ABR style practice questions.